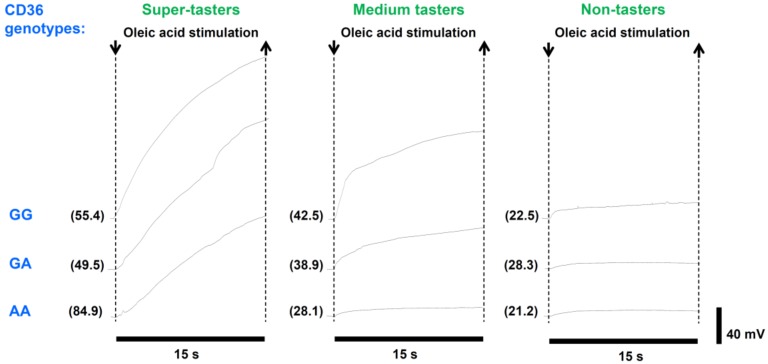
Figure 4.
Examples of electrophysiological recordings in response to oleic acid (30 µL) taste stimulation in representative super-tasters, medium-tasters and non-tasters with different genotypes of the CD36 gene. The very first data point on the left side of each electrophysiological recording represents the baseline. Numbers within parentheses on the left of each trace indicate the density of fungiform papillae (No./cm2) of each subject calculated in the small circular area of the tongue where oleic acid stimulation was applied.

