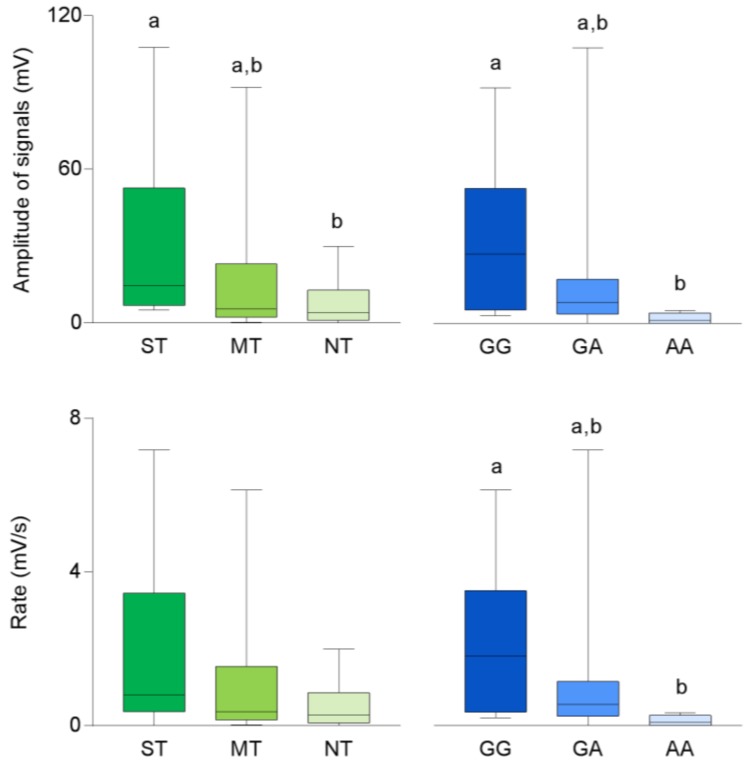
Figure 5.
Box-and-whisker plots showing the minimum, first quartile, median, third quartile, and maximum of each data set of amplitude and rate of signals evoked in super-tasters (ST; n = 10), medium tasters (MT; n = 13) and non-tasters (NT; n = 12); and in volunteers with genotypes GG (n = 9), GA (n = 20) and AA (n = 6) of CD36 by oleic acid (30 µL) taste stimulation. Different letters indicate a significant difference (p ≤ 0.05; Fisher LDS or Duncan’s test subsequent one-way ANOVA).

