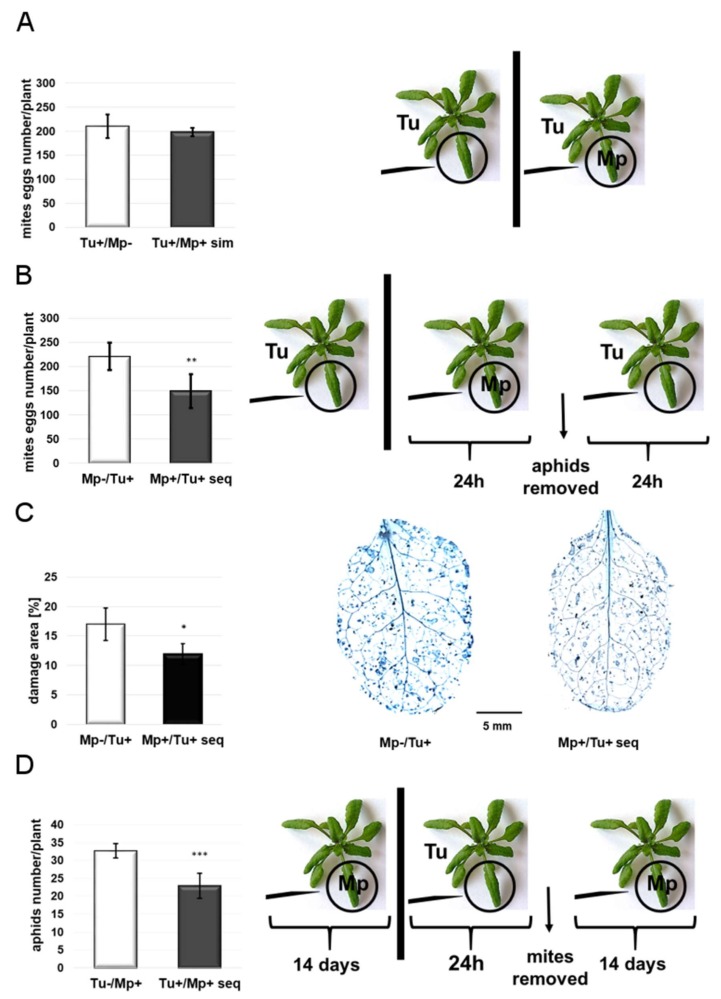
Figure 1.
TSSM (Tu) and GPA (Mp) reproductive performance. (A) TSSM oviposition rate expressed as the number of mite eggs x plant-1 after simultaneous plants infestation with GPA and TSSM (±SD; n = 6). (B) TSSM oviposition rate expressed as the number of eggs × plant−1 after sequential infestation of plants by GPA and TSSM (±SD; n = 6). (C) Mite-leaf damage visualization by TB staining assessment -extent of damage assessed by the percentage of damaged leaf area (±SD; n = 3). Scale bar indicates magnification. (D) The effect of TSSM infestation on GPA reproduction (±SD; n = 9). Asterisks indicate significant differences (the two-tailed—t-test) at p-values of <0.05 *; <0.01 **; <0.001 ***).

