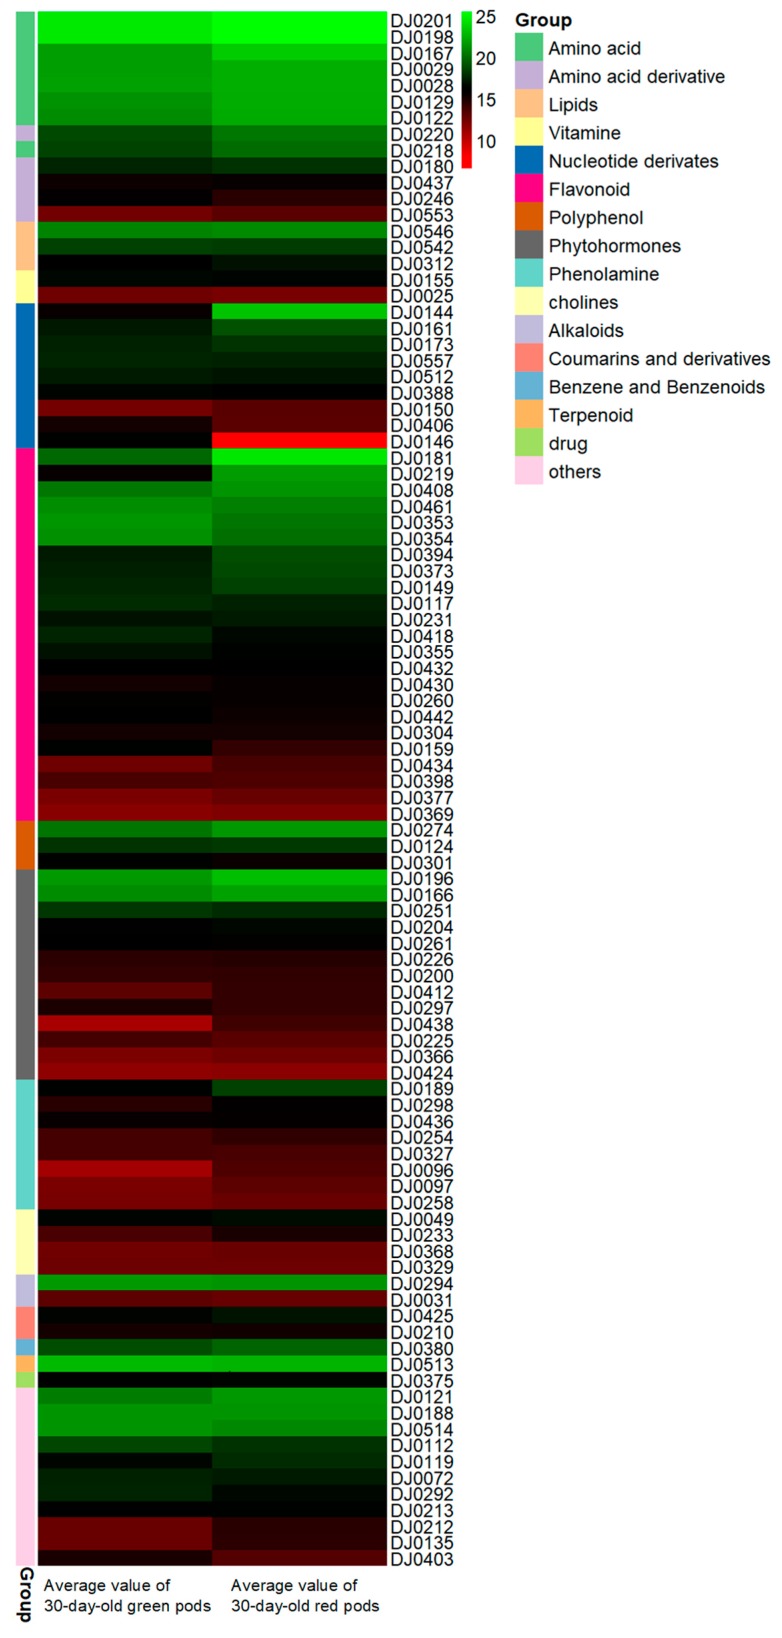
Figure 2.
Significantly different metabolites in 30-day-old green (left) and red (right) pods. Significantly different metabolites of 30-day-old green and red pods after anthesis were assessed by variable important in projection (VIP) and fold change. Each different color rectangle on the left side of the heatmap represents one metabolite. The content of different metabolites in each class decreases from top to bottom in the samples. The numbers on the right side of the picture were the codes of the result of the LC-ESI-MS/MS, with specific information shown in Table S1. The names of different types of metabolites are displayed on the right side of the chart. The values in picture are the averages of three biological duplicate samples.

