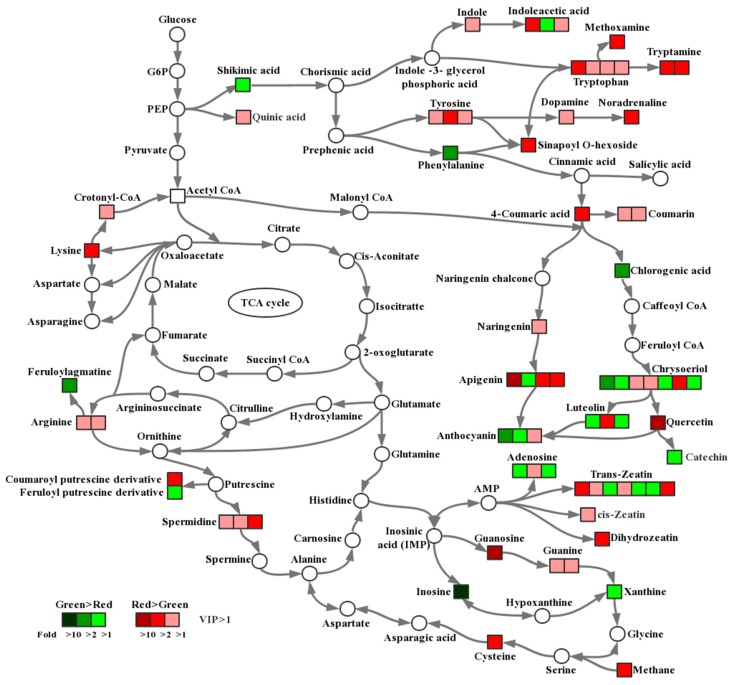
Figure 4.
Comparison of metabolite accumulation in different pathways between green and red pods. Significant metabolite changes (VIP > 1) observed in red pods versus green pods are shown in the metabolic map. Metabolites shown as squares were detected in this study, whereas those shown as circles were undetectable. The squares in red indicate that the content of the metabolite in red pods was higher than that in green pods, and the darker the color, the larger the difference. Similarly, the squares in green indicate that the content of the metabolite in green pods was higher than that in red pods, and the darker the color, the larger the difference. The level of significance was set at VIP > 1.

