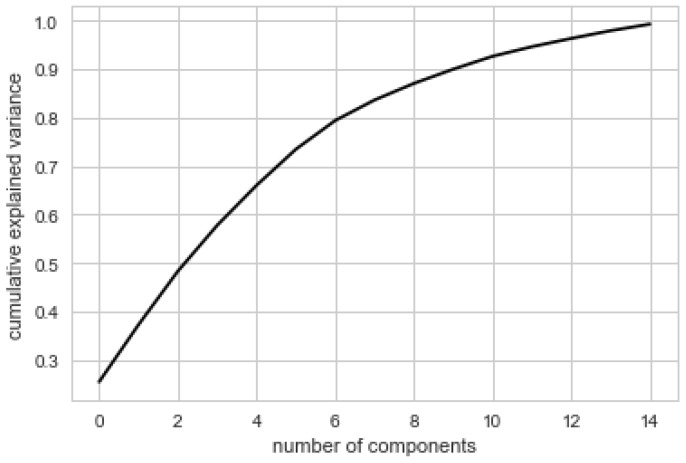
Figure 6.
PCA analysis: proportion of variance explained by the principal components of the algorithm. Data = NHANES 2011–2012, day 1, women aged 31–50 years, non-lactating or pregnant (n = 155). This shows the amount of variance between each of the nutrients in the model. PCA: principal component analysis.

