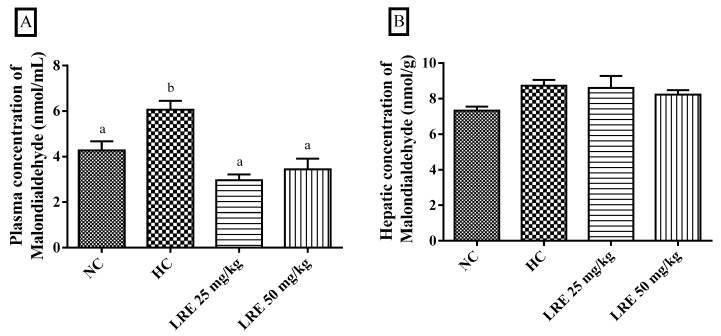
Figure 5.
Concentration of malondialdehyde (MDA) in plasma (A) and liver (B) of hamsters submitted to experimentally induced dyslipidemia and treated with the lycopene-rich extract from LRE. Each column represents mean ± SEM (standard error of the mean) of 7-9 animals/group. Two mean values that are not indicated with the same letter are significantly different from each other (p < 0.05). One-way ANOVA followed by Tukey’s test.

