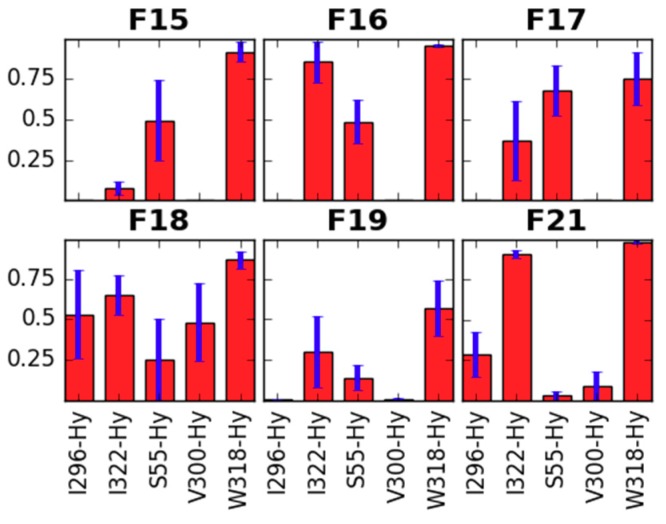
Figure 8.
Interactions of the 4-axial substituent with the receptor residues. Red bars represent the mean frequency of contacts with a particular residue, and blue bars show standard error of the mean. Data are collected from last 10 ns of production in 3 replicas. In x-axis label given is the residue’s name and number as well as type of the contact (Hb—hydrogen bond, Hy—hydrophobic, A—aromatic).

