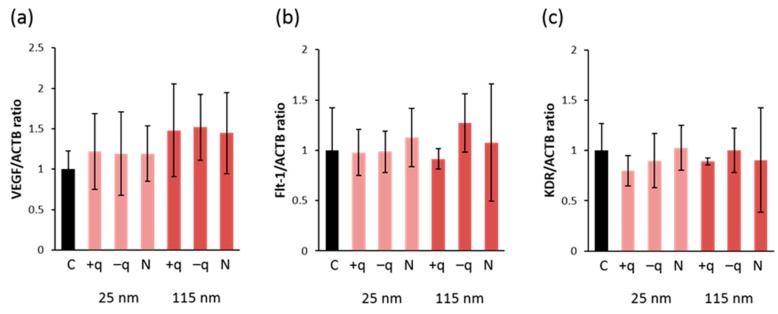
Figure 3.
Gene expression of VEGFa and VEGF receptors in zebrafish. Expression levels of (a) VEGFa and VEGF receptors: (b) Flt-1 and (c) KDR in embryos exposed to 100 mg/L of 25 or 115 nm SiO2 NPs with different surface-charge at 48 and 72 hpf. The mRNA levels were normalized by the amount of β-action mRNA. Data are represented as mean ± SD.

