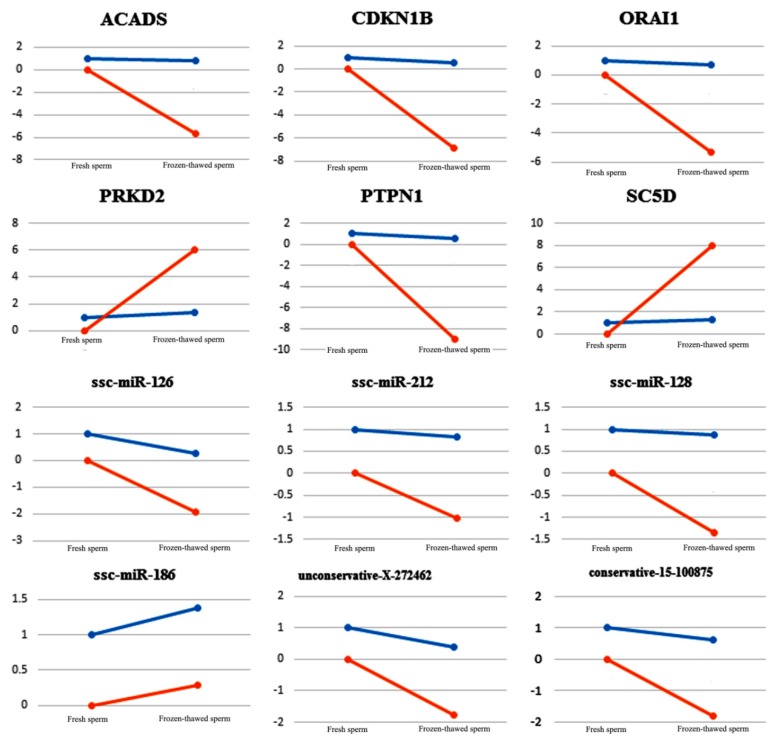
Figure 5.
qRT-PCR validation of 12 differentially expressed miRNAs and mRNAs in fresh and frozen-thawed boar sperm. Blue line segments represent the result from small RNA and transcriptome sequencing. Red line segments represent the result from qRT-PCR. Detailed data are shown in Table S8.

