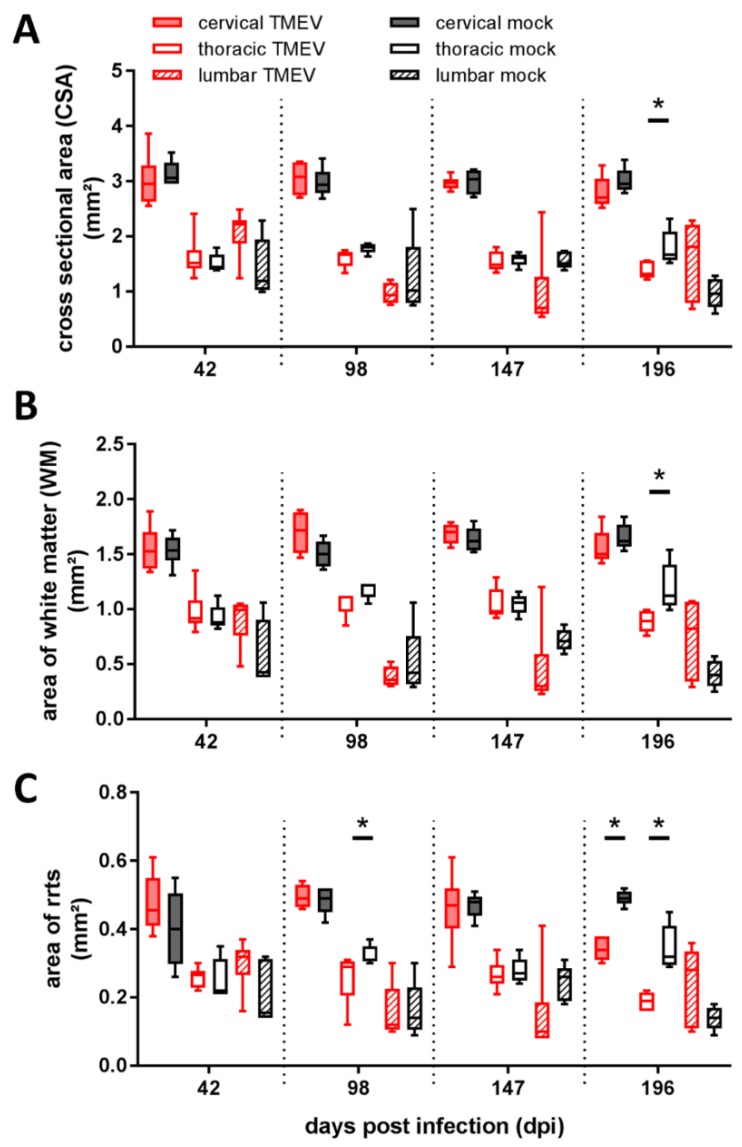
Figure 2.
Assessment of spinal cord areas revealed a significant reduction of cross-sectional area at 196 dpi within the thoracic segment (A), accompanied by a reduction of thoracic white matter area at 196 dpi (B) and a reduction of the area of rostral reticulospinal tract (rrts) within the thoracic segment at 98 dpi and within the cervical and thoracic segment at 196 dpi (C). Graphs display box and whisker plots. Significant differences between groups detected by Mann–Whitney U-test were indicated by asterisks (* p ≤ 0.05), GM = gray matter, WM = white matter.

