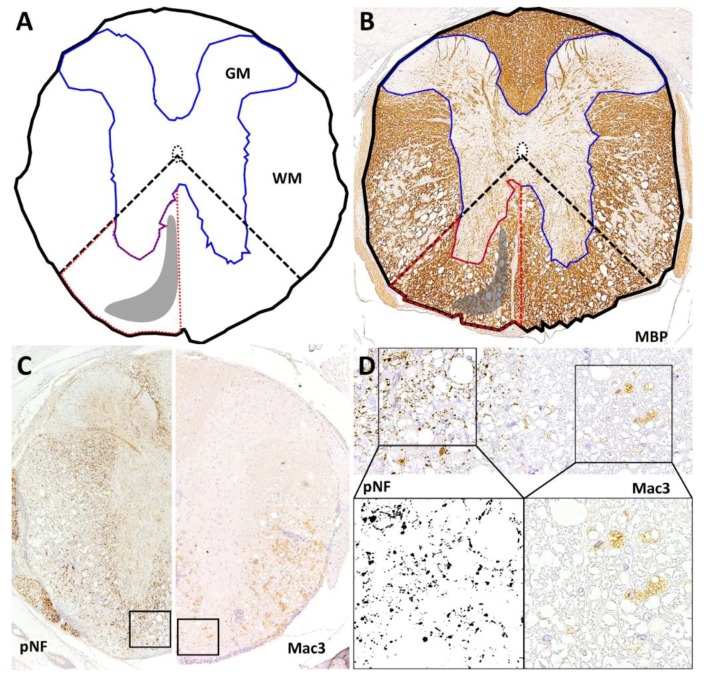
Figure 7.
Quantification of cross-sectional area (CSA; black line), white matter (WM), gray matter (GM; blue line) and the approximated area of the rostral reticulospinal tract (rrts; red dashed line) using MBP-stained sections. Localization of rrts is marked as gray area. Area of rrts was approximated via an angle bisector (dashed line) between a vertical and horizontal line intersecting at the central canal (matrix: A; application example: B) For assessment of axonal loss and inflammation, images from the rrts were taken at high magnification (40× objective). One picture was taken from the left and right ventromedial white matter each, saved as tiff file (C) and a counting frame (120 μm × 120 μm) was inserted (D). For quantification of axonal density, images were converted to 8bit grayscale (D). After an adjustment of threshold axons were counted and separated in small (1–<4 μm2) and large axons (≥4 μm2) via adjustment of size of the detected particles. Axonal density was calculated as pNF+ particles per mm2. Mac3+ cells within the counting frame were counted manually and calculated as Mac3+ cells per mm2 (D).

