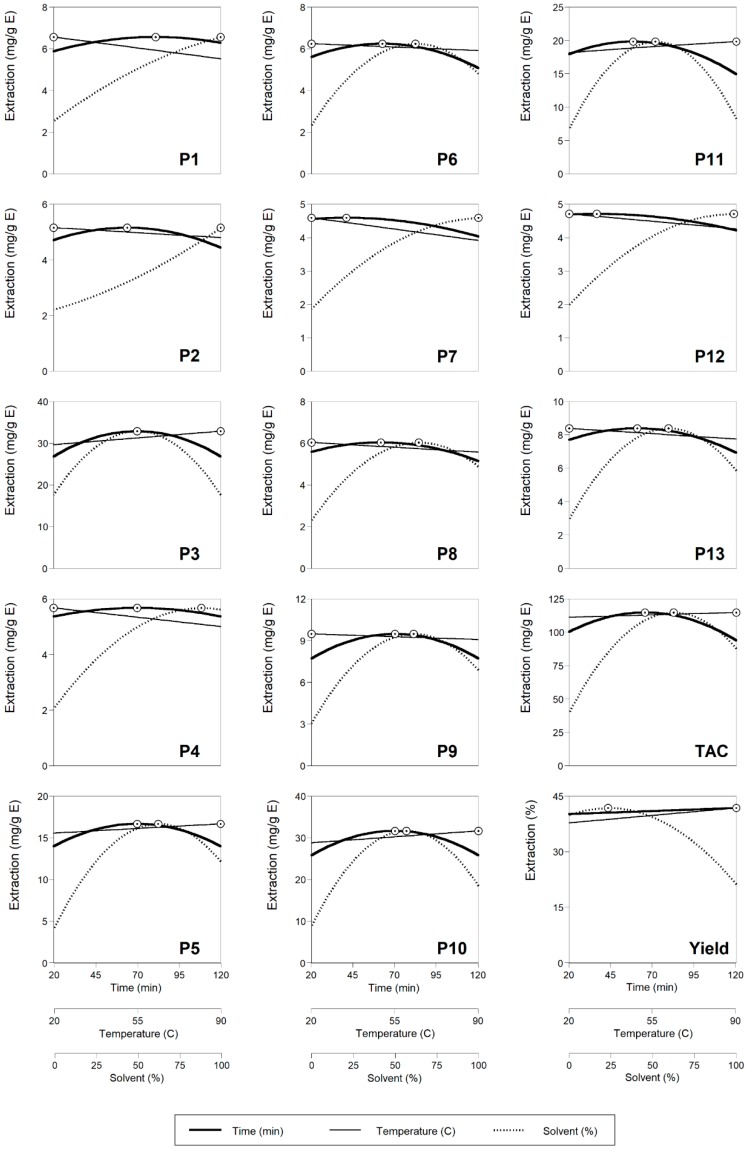
Figure 4.
2D graphical response of the effects of the independent variables on the extraction of anthocyanin compounds from red rubin basil leaves (see Figure 1 for peak identification). Dots (ʘ) represent the optimal values. In each plot, each independent variable was positioned at the optimal value of the other two variables (Table 3).

