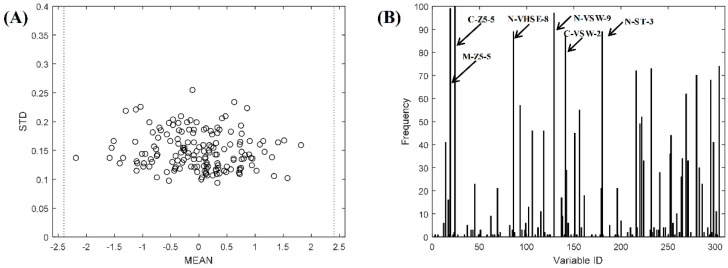
Figure 3.
The result of QSAR model building on the FRAP dataset. (A) The result of MPA-based outlier detection on the FRAP dataset of integrated descriptors. No outlier was detected. (B) Frequency of variables selected by the BOSS method on the FRAP dataset in 100 runs. The higher frequency denotes higher variable importance. The six top variables with frequency larger than 75 are marked in the figure.

