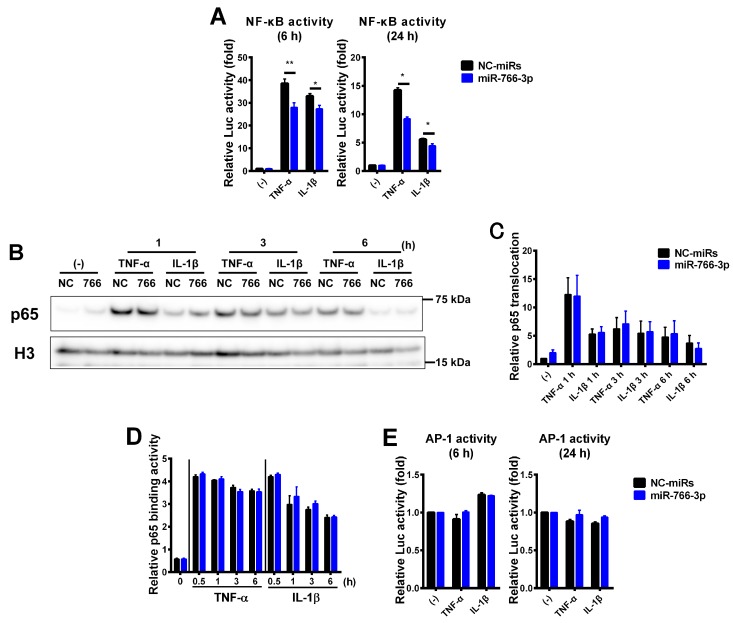
Figure 3.
Suppression of cytokine-induced nuclear factor-κB (NF-κB) activation by miR-766-3p. (A) MH7A cells were co-transfected with pNF-κB-Luc along with miRNA mimics and were then exposed to TNF-α or IL-1β for 6 or 24 h. Cells were then subjected to a luciferase assay to evaluate the activity of NF-κB. The luciferase activity was normalized by the number of viable cells and then normalized to the respective values in the vehicle samples. Assays were performed in sextuplicate or quadruplicate, and data are expressed as the mean ± SEM. Asterisks indicate a statistically significant difference (*, p < 0.05; **, p < 0.01). (B) MH7A cells were transfected with miRNA mimics and stimulated by TNF-α or IL-1β for 1 to 6 h. The cells were harvested, and nuclear protein were extracted. Western blotting of p65 was performed. The expression of histone H3 (H3) is shown as a loading control. (C) A densitometric analysis of the data shown in (B). Western blotting was performed in quadruplicate. Representative data are shown. Data are expressed as the mean ± SEM. (D) MH7A cells were transfected with miRNA mimics and stimulated by TNF-α or IL-1β for 0.5 to 6 h. Cells were subjected to a TransAM assay to evaluate the DNA binding activity of the NF-κB p65 subunit. Assays were performed in triplicate or quadruplicate. Data are expressed as the mean ± SEM. (E) MH7A cells were co-transfected with pAP-1-Luc along with miRNA mimics and were then exposed to TNF-α or IL-1β for 6 or 24 h. Cells were then subjected to a luciferase assay to evaluate the activity of AP-1. The luciferase activity was normalized by the number of viable cells and then normalized to the respective values in the vehicle samples. Assays were performed in duplicate, and data are expressed as the mean ± SEM.

