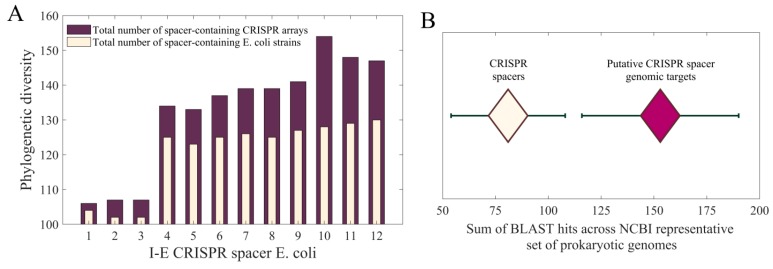
Figure 3.
(A) Phylogenetic distribution of I-E E. coli CRISPR spacers throughout the domain of bacteria vs. E. coli species; (B) Phylogenetic distribution of I-E E. coli CRISPR spacers and their putative genomic targets across the NCBI representative set of prokaryotic genomes. For CRISPR array, the sum of hits obtained for all 12 spacers (with three standard deviations) is shown (white diamond). For CRISPR spacer genomic targets (19 targets per spacer), the mean number of hits, summed over 12 spacers, with three standard deviations, is shown (purple diamond).

