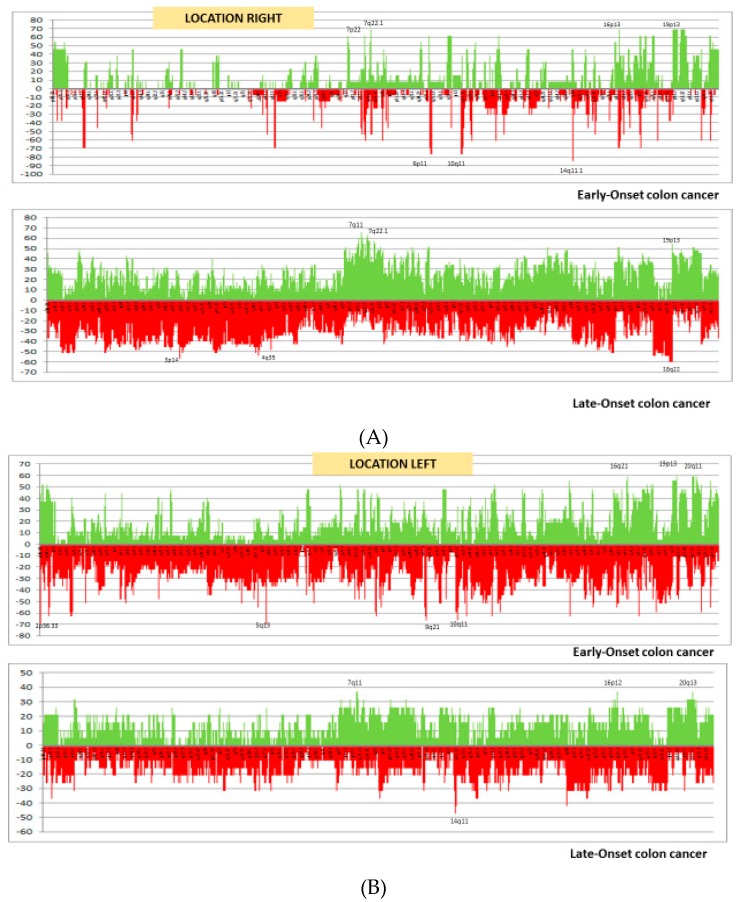
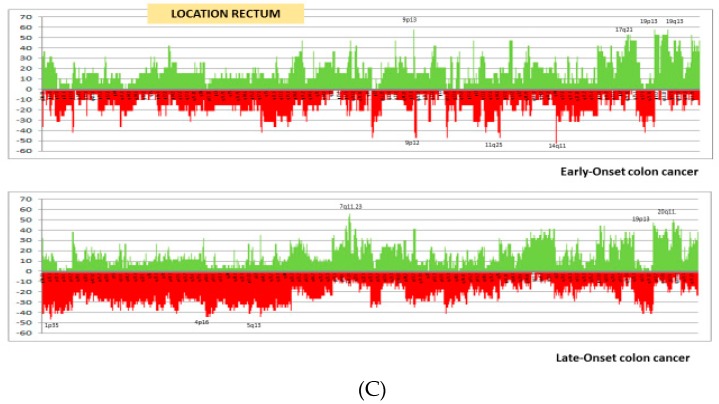
Figure 1.
Frequency plots of copy number gains (above zero, green) and losses (below zero, red) defined for each subgroup. The fraction gained or lost is plotted on the y-axis versus genomic location on the x-axis. (A) Comparison of right-sided cancers in EOCC and LOCC; (B) comparison of left-sided cancers in EOCC and LOCC; (C) comparison of rectal cancers in EORC and LORC. EOCC: Early-onset colon cancer; EORC: Early-onset rectal cancer; LOCC: Late-onset colon cancer; LORC: Late-onset rectal cancer.


