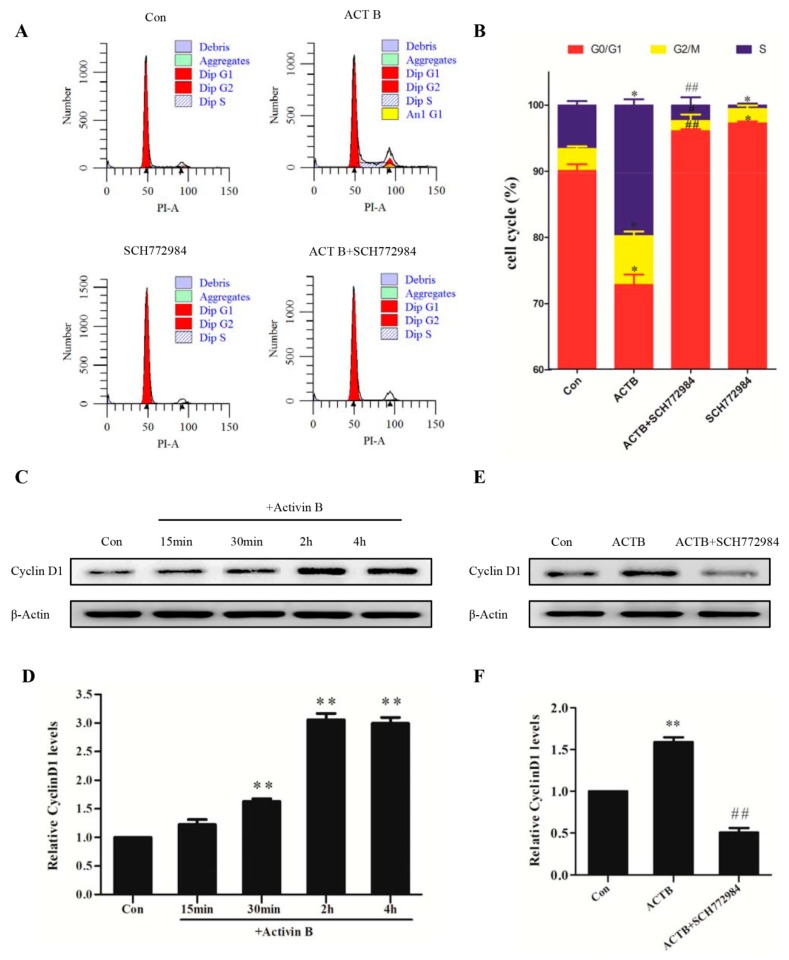
Figure 5.
Activin B accelerated the cell cycle transition of HHGMCs from the G0/G1 phase to the S phase through the ERK–Cyclin D1 pathway. (A) HHGMCs were serum starved for 24 h and pretreated with or without SCH772984 (5 μM) for 2 h. After treatment with 10 ng/mL Activin B or PBS for 48 h, the cell cycle distribution was measured by flow cytometry using propidium iodide (PI) staining. (B) The percentages of cell cycle phase in G0/G1, S, and G2/M are shown in a bar graph form. (C,D) The plot and the relative quantification of the expression of Cyclin D1 in the cells treated with 10 ng/mL Activin B for 15 min, 30 min, 2 h, and 4 h. (E,F) The plot and the relative quantification of the expression of Cyclin D1 in the cells pretreated with SCH772984. * p < 0.05; ** p < 0.01, compared with the PBS group. # p < 0.05; ## p < 0.01, compared with Activin B group. Three independent experiments were conducted per data point. All error bars indicate SEM.

