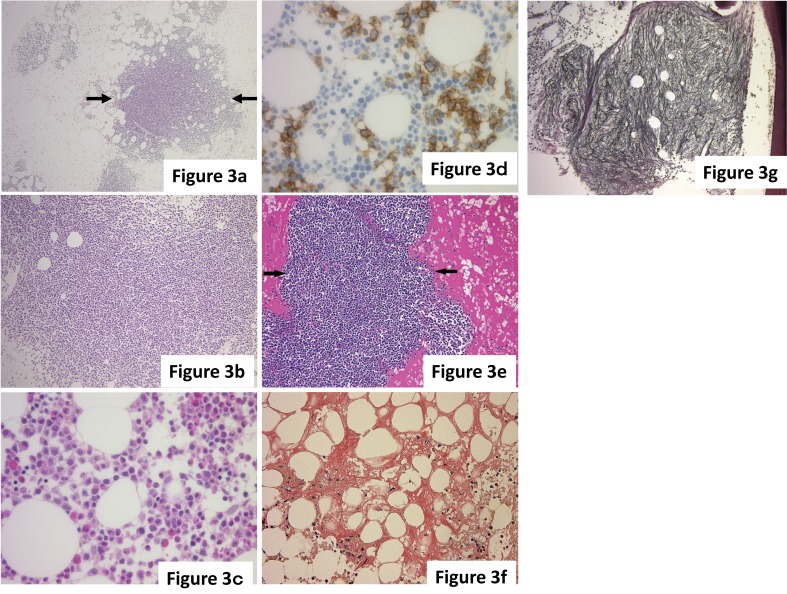
Fig. 3.
(a-d) The infiltration pattern of myeloma. (a) Nodular pattern. Myeloma cells form a nodular lesion (arrows), and the border with the surrounding hematopoietic cells is clear. (b) Diffuse pattern. Myeloma cells exhibit diffused infiltration into the bone marrow, and hematopoietic cells are markedly reduced. (c, d) Interstitial pattern. (c) Myeloma cells are scattered between normal hematopoietic cells with occasional small clusters, but identification of neoplastic cells based on morphology is difficult. (d) CD138(+) myeloma cells are easily identified. (e-g) Secondary changes with myeloma. (e) Interstitial acidophilic change. The stroma exhibits acidophilic changes reflecting hyperproteinemia. Arrows indicate a nodular lesion of myeloma. (f) Amyloid deposition. Amyloid deposition, indicated by the orange stain, is broadly observed in the stroma. (g) Myelofibrosis (grade 2). Reticular fibers are diffusely increased in the nodular lesion of myeloma cells. In this case, the genetic abnormality FGFR3-IGH was identified by FISH. (a-c, e) HE staining. (d) Immunohistochemical staining. (f) Congo red staining. (g) Reticular staining.

