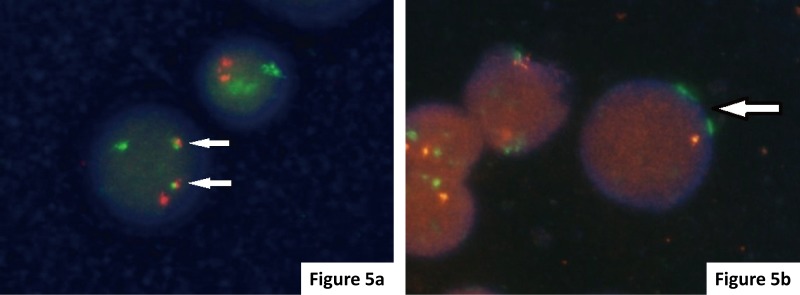
Fig. 5.
FISH analysis of myeloma cells. (a) FGFR3-IGH: The presence of t(4;14) was noted in this case showing 1 red FGFR3 signal, 1 green IGH signal, and 2 yellow fusion signals (arrows). (b) TP53 deletion: The presence of del (17p) was identified in this case showing 1 red TP53 signal and 2 green CEP 17 signals (arrows).

