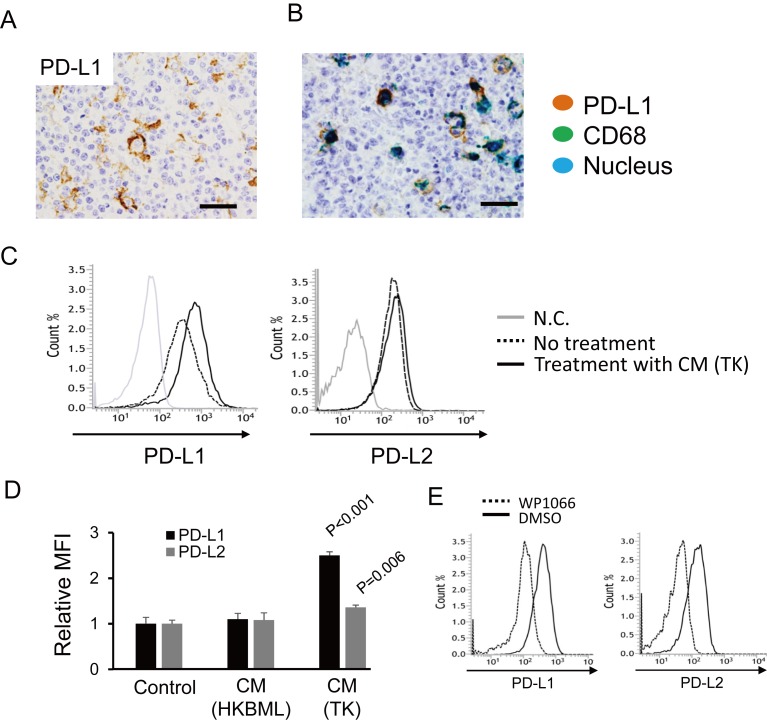
Fig. 1.
The expression of PD-1 ligands on macrophages. (A) Immunohistochemistry for PD-L1 in PCNSL. Scale bar: 50 μm. (B) Double immunohistochemistry for CD68 (green) and PD-L1 (brown) was performed, and a representative photomicrograph is presented. Scale bar: 50 μm. (C) The expression of PD-L1 and PD-L2 was examined with flow cytometry after macrophages were stimulated with CM from the TK and HKBML cell lines. (D) Mean fluorescence intensities (MFI, n = 3 for each group) were compared. Significance was determined with the Student’s t-test. (E) Macrophages were stimulated by CM from TK cells with or without a Stat3 inhibitor (WP1066) for 24 hours, and PD-L1 and PD-L2 expression was assessed with flow cytometry.

