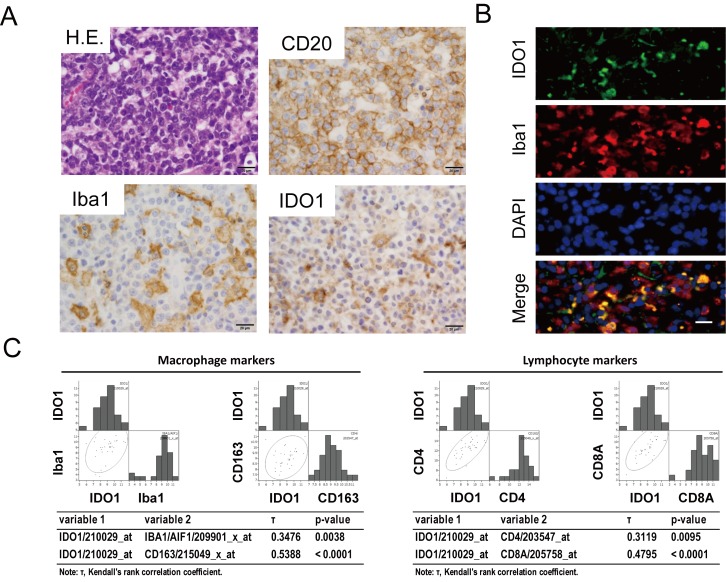
Fig. 3.
IDO1 expression in TAMs. Immunohistochemistry for CD20, Iba1, and IDO1 is presented (A). Double immunofluorescence for Iba1 and IDO1 (B). Scale bar: 20 μm. (C) A non-parametric rank correlation analysis was performed to measure the strength of the relationship between two variables. Kendall’s tau (τ) rank correlation coefficient analysis assessed statistical associations based on the ranks of the data. P < 0.05 was considered statistically significant.

