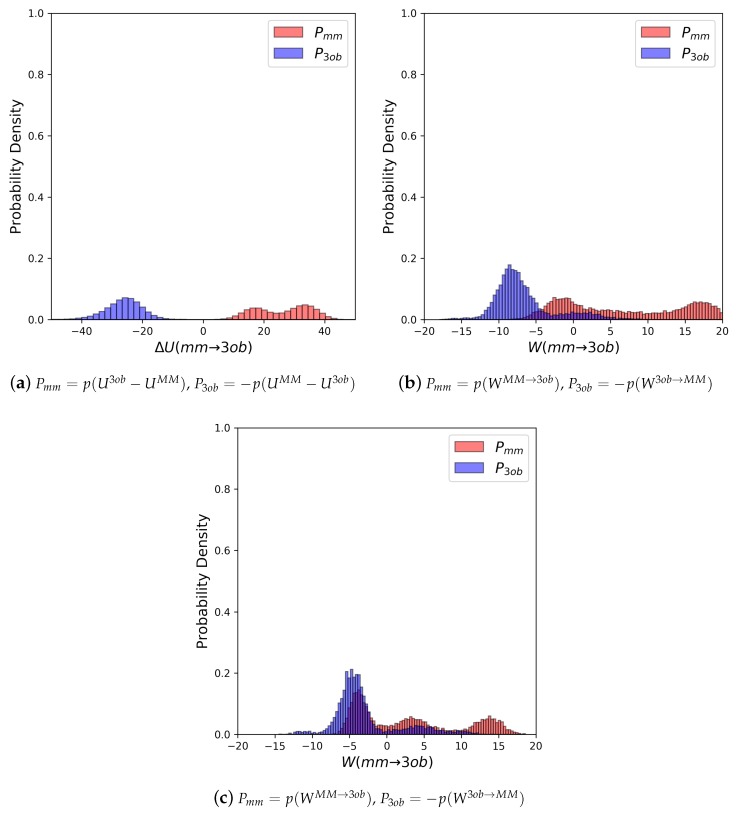
Figure 12.
(a) Molecule 9’s potential energy “forward” () and “backward” () distributions plotted as “offset” from the to simplify the x-axis. (b) Molecule 9’s nonequilibrium work “forward” () and “backward” () distributions from 1 ps switching simulations plotted as “offset” from the to simplify the x-axis. (c) Molecule 9’s nonequilibrium work “forward” () and “backward” () distributions from 5 ps switching simulations plotted as “offset” from the to simplify the x-axis.

