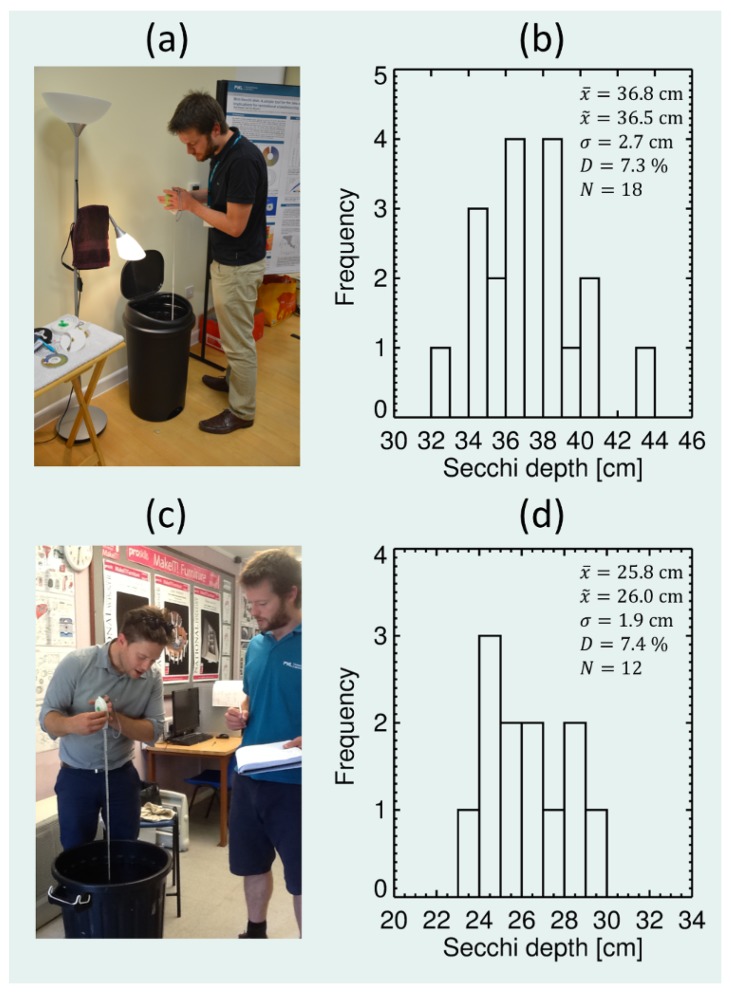
Figure 9.
Quantifying uncertainty arising from different individuals reading the Secchi depth. The experimental set up consisted of a mini-Secchi disk and a bin filled with water and food colouring. (a) Experimental set-up at the Challenger Society and Remote Sensing and Photogrammetry Society Marine Optics Special Interest Group (MOSIG) on the 16th December 2013. (b) Histogram of Secchi depth readings taken at the MOSIG meeting. (c) Experimental set-up during a design and technology lesson at a secondary school at Chatham and Clarendon Grammar School on the 4th July 2014. (d) Histogram of Secchi depth readings during the design and technology lesson. is the average Secchi depth, is the median Secchi depth, is the standard deviation of the Secchi depth readings, D is the percentage deviation (/) and N is the number of measurements.

