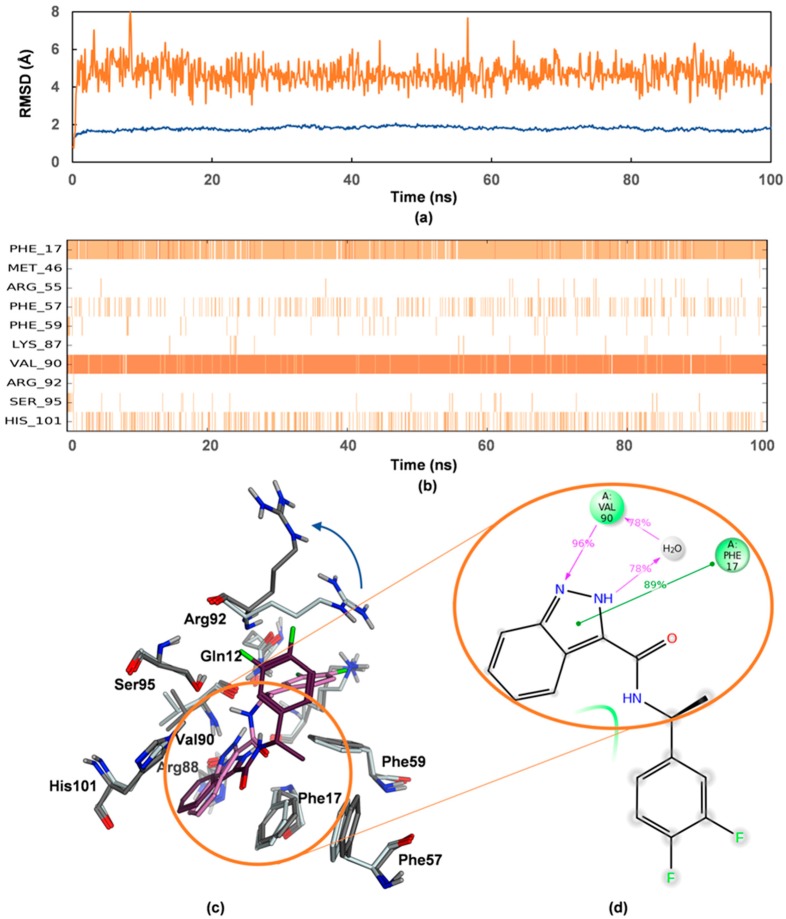
Figure 6.
Dynamics of hnRNP A1-80051 complex during 100 ns MD simulations with explicit solvent. (a) RMSD displacement during the simulation trajectory of the protein side chains (blue) and of the ligand with respect to the protein (orange); (b) Protein-ligand contacts during the simulation time course. Val90 and Phe17 are main stabilizing residues with His101 and Phe57 seconding; (c) Three-dimensional superimposition of hnRNP A1 binding site and VPC-80051 at the beginning of the simulation and after 88.4 ns simulation time. Light grey and light magenta indicate the protein residues and the ligand in the reference frame while dark grey and dark magenta indicate the residues and the ligand in the selected 88.4 ns snapshot. The blue curved arrow indicates the larger movement of Arg92 side chain during the simulation; (d) Two-dimensional schematic of detailed interactions between VPC-80051 atoms with the protein residues. Stabilization of the ligand occurs via hydrogen bonding and water bridges with Val90 (purple arrow pointed lines) and π-π interactions with Phe17 (green lines). The percentages indicate the strength of ligand-protein interactions.

