Figure 1.
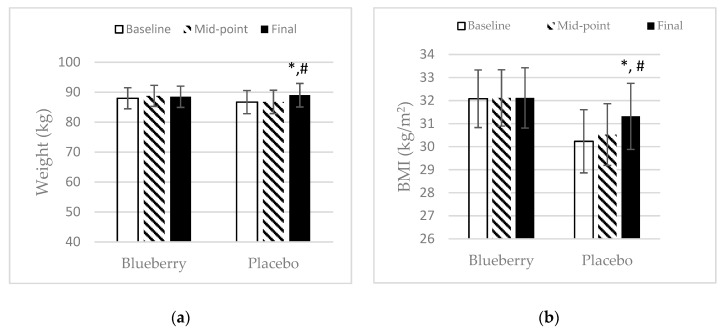
Effect of blueberry and placebo on weight and BMI: (a) Weight. Mean ± SEM. N = 27 for the blueberry group, N = 22 for the placebo group. *, significance as compared to baseline (p < 0.05); #, significance as compared to midpoint (p < 0.05). The mean difference between final point and baseline is a net change of +2.31 kg. (b) Mean ± SEM. N = 24 for the blueberry group, N = 20 for the placebo group. Outliers were omitted. *, significance as compared to baseline (p < 0.05); #, significance as compared to midpoint (p < 0.05). The mean difference between final point and baseline is a net change of +1.10 kg/m2.

