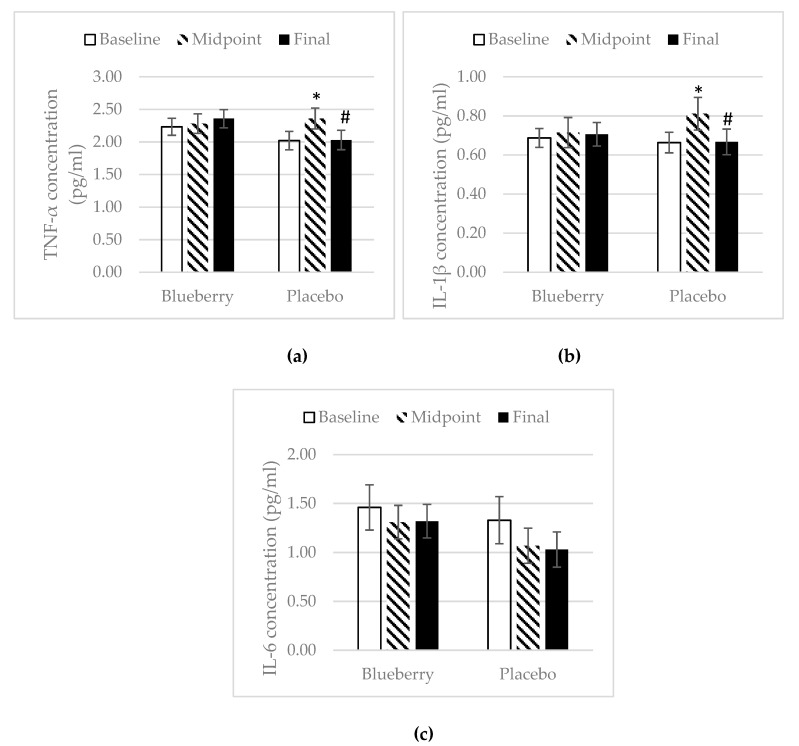
Figure 5.
Tumor necrosis factor (TNF)-α, interleukin (IL)-1β, and IL-6. Mean ± SEM. (a) TNF-α, N = 26 for the blueberry group, N = 21 for the placebo group; (b) IL-1β, N = 26 for the blueberry group, N = 22 for the placebo group; (c) IL-6, N = 22 for the blueberry group, N = 20 for the placebo group. *, significance as compared to baseline (p < 0.05); #, significance as compared to midpoint (p < 0.05).

