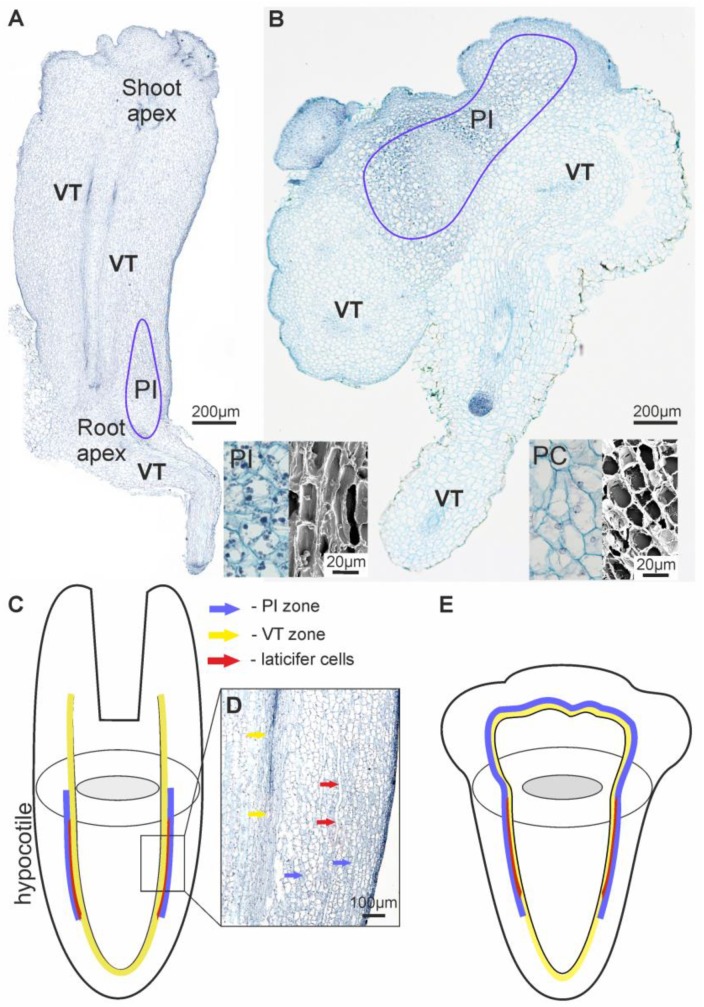
Figure 3.
Histological images and schematic representations of the S2 differentiated structures. (A) A somatic embryo at the last torpedo stage. (B) A nodule with root. (C) A schematic representation of stepharine localization in a somatic embryo. (D) Histology section of the hypocotyl portion of a somatic embryo. (E) A schematic representation of stepharine localization in a nodule with root. Blue arrow and lines indicate localization of PI cells; red arrow indicates laticifer cells; yellow arrow and lines indicate VT cells. PC, parenchymal cells (histology and scanning electron microscopy (SEM) view); VT, vascular tissue with companion cells; PI, parenchymal cells with inclusions (histology and SEM view).

