Figure 5.
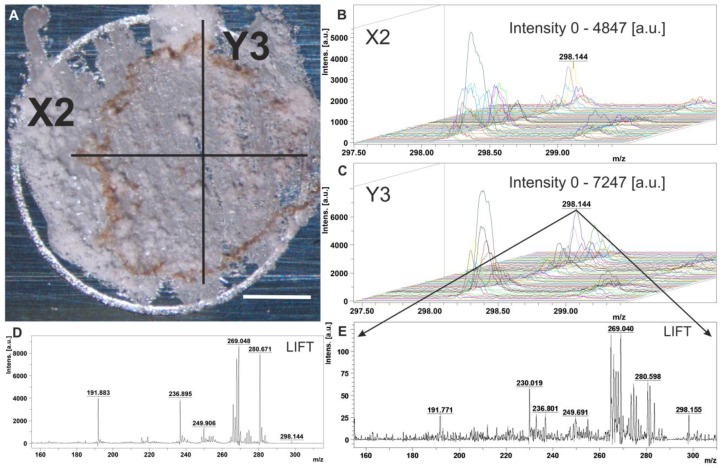
Direct matrix-assisted laser desorption/ionization mass spectrometric (MALDI-MS) analysis of a transverse section of the root nodule. (A) Image of the nodule with root sliced with raster (axis) direction. Bar, 10 mm. (B) MALDI-MS distribution of molecular mass m/z 298.142 across the nodule with root by raster X2. (C) MALDI-MS distribution of molecular mass m/z 298.142 across the root nodule by raster Y3. (D) MS/MS profile of precursor ions with m/z 289.144 from the root nodule. (E) MS/MS profile of precursor ions with m⁄z 289.144 from the standard solution. (a.u.), arbitrary units.

