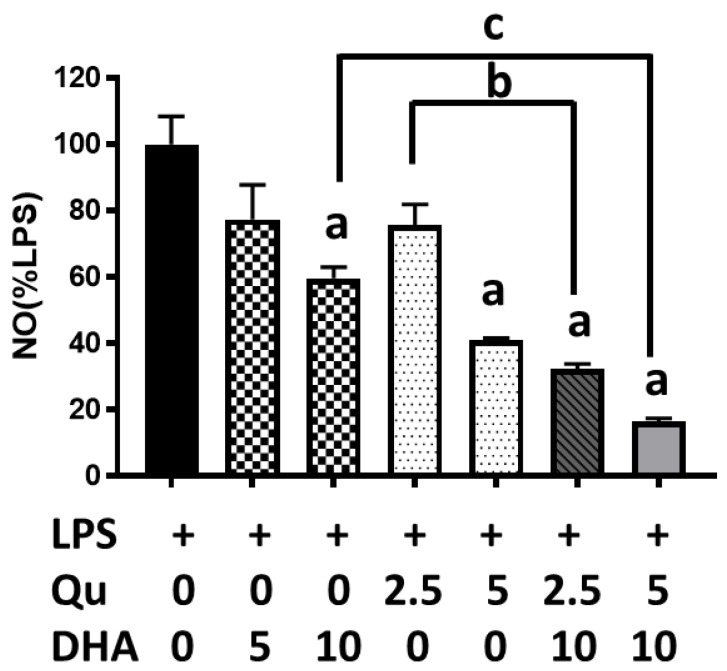
Figure 1.
Effects of docosahexaenoic acid (DHA) (5 and 10 μM) and/or quercetin (2.5 and 5 μM) on lipopolysaccharide (LPS)-induced nitric oxide (NO) production in microglial cells. NO was measured using the Griess reaction protocol. NO data obtained from cells without LPS were subtracted from cells with LPS, and the differences were regarded as 100%. Results from three individual cell passages with triplicate assays from each passage are expressed as the mean ± SEM (n = 3) and analyzed by one-way ANOVA followed by Tukey’s post-tests. “a” represents significant differences (p < 0.01) between control versus LPS. “b” and “c” represent significant differences (p < 0.05) between the indicated pairs.

