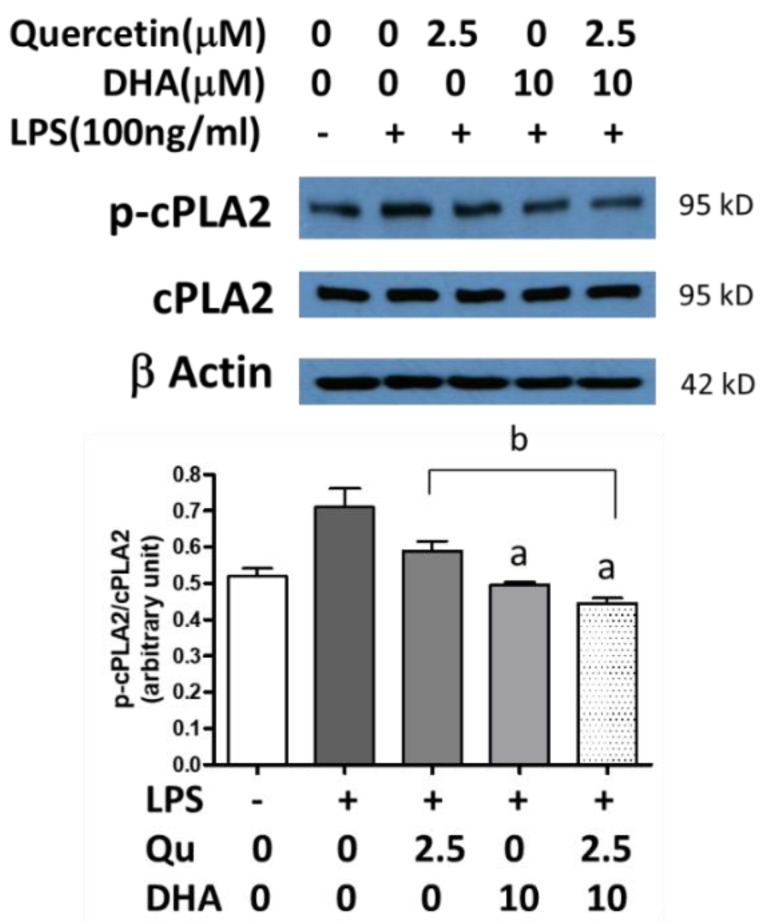
Figure 4.
Effects of DHA and/or quercetin on LPS-induced phospho-cytosolic phospholipase A2 (p-cPLA2) expression in microglial cells. Data represent p-cPLA2/cPLA2 ratios from three individual experiments. “a” represents significant differences (p < 0.01) between control versus treatments. “b” represents significant differences (p < 0.05) between the indicated pairs.

