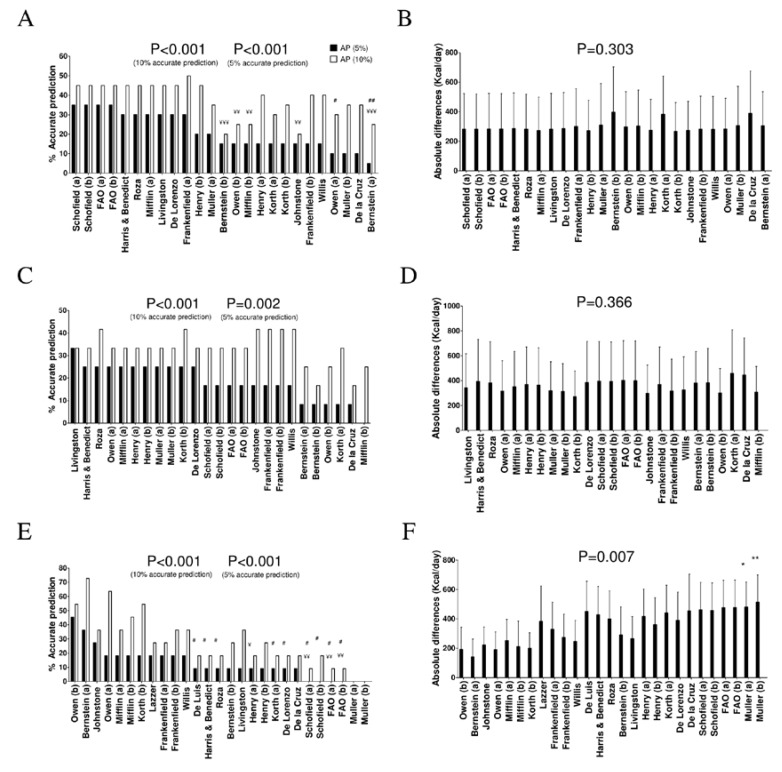
Figure 1.
Percentage of accurate prediction of resting energy predictive equations and differences of mean absolute values between predicted and measured resting energy expenditure in men by weight status categories. (A) Percentage of accurate prediction at 5% and 10% of measured resting energy expenditure in normal weight men. (B) Mean (SD) absolute differences between predicted and measured resting energy expenditure in normal weight men. (C) Percentage of accurate prediction at 5% and 10% of resting energy expenditure measured in overweight men. (D) Mean (SD) differences between predicted and measured resting energy expenditure in absolute values in overweight young men. (E) Percentage of accurate prediction at 5% and 10% of resting energy expenditure measured in obese men. (F) Mean (SD) differences between predicted and measured resting energy expenditure in absolute values in obese men. (a) and (b) refer to predictive equations that are proposed by the same author, but require different anthropometry or body composition parameters. p-value of repeated measures analysis of variance (with Bonferroni post-hoc analysis) among the predictive equations. * p < 0.05; ** p < 0.01 when compared with the predictive equation that presented minor absolute differences with measured resting energy expenditure. ¥ p < 0.05; ¥¥ p < 0.01; ¥¥¥ p < 0.001 when compared with the predictive equation that presented the best resting energy expenditure accurate prediction (10%) with measured resting energy expenditure. # p < 0.05; ## p < 0.01; ### p < 0.001 when compared with the predictive equation that presented the best resting energy expenditure accurate prediction (10%) with measured resting energy expenditure. AP: accurate predictions. Abbreviations: FAO, “Food and Agriculture Organization of the United Nations/World Health Organization/United Nations” equation.

