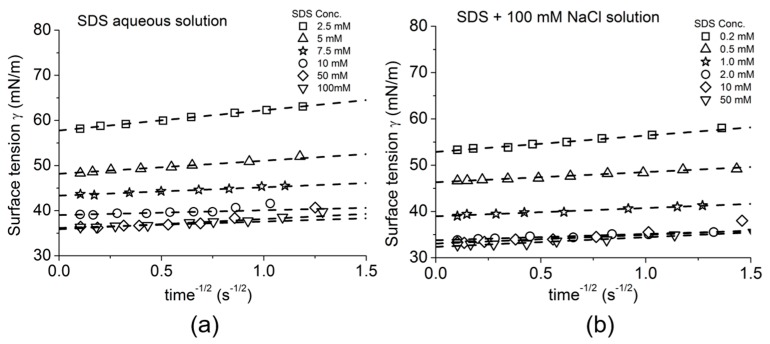
Figure 17.
SDS dynamic surface tension at 20 °C plotted according to the Ward–Tordai long-time approximation model Equation (7). SDS surface tensions are plotted as a function of t−1/2. (a) SDS surface tensions for different SDS aqueous solution concentrations made up in milli pure water from 2.5 to 100 mM. (b) SDS surface tensions for different SDS solution concentrations from 0.2 to 50 mM, made up in 100 mM NaCl. The intercept of each fitting line showed agreement with the equilibrium surface tension at each concentration. With permission from Elsevier [8].

