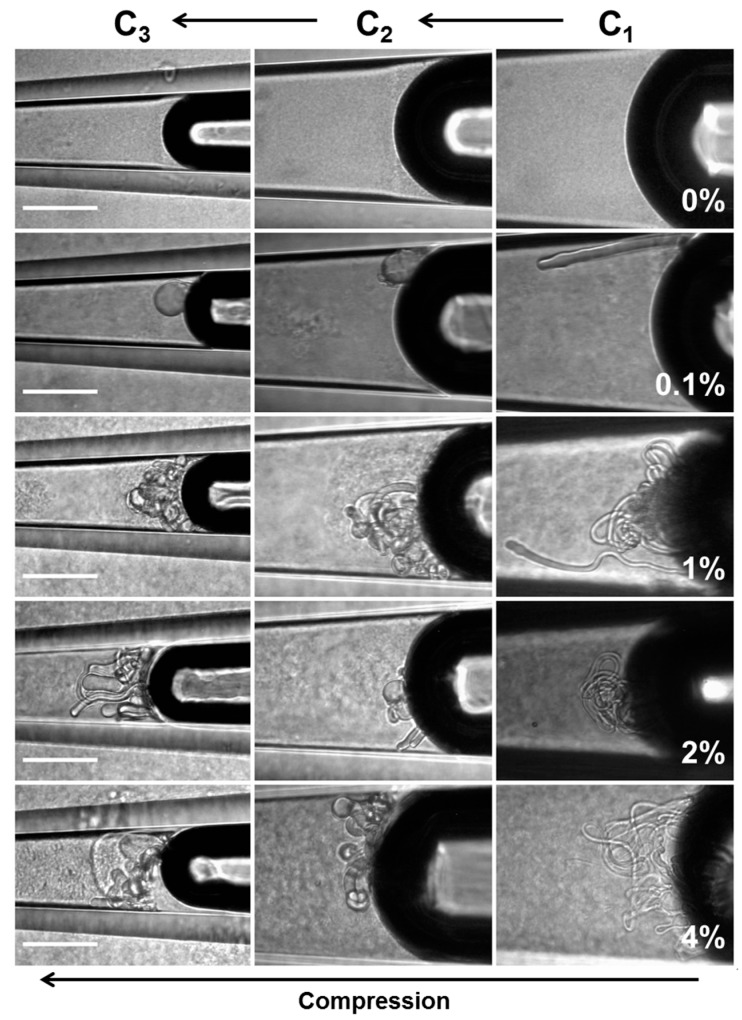
Figure 25.
Microtubules formation and growth at 37 °C. Air-water surfaces are shown in the tapered micropipette for a series of increasing SMB concentrations from 0 to 4 wt% in the Phospholipid (PL) mixture solution. Each meniscus is moved down the micropipette taper by increasing the micropipette pressure from 0.7, 1 and 2 kPa, to give the sequential surface compressions C1, C2 and C3, respectively. In each case, compressions were made, and images were obtained after a 10 min waiting period. The scale bar is 50 μm. With permission from American Chemical Society [10].

