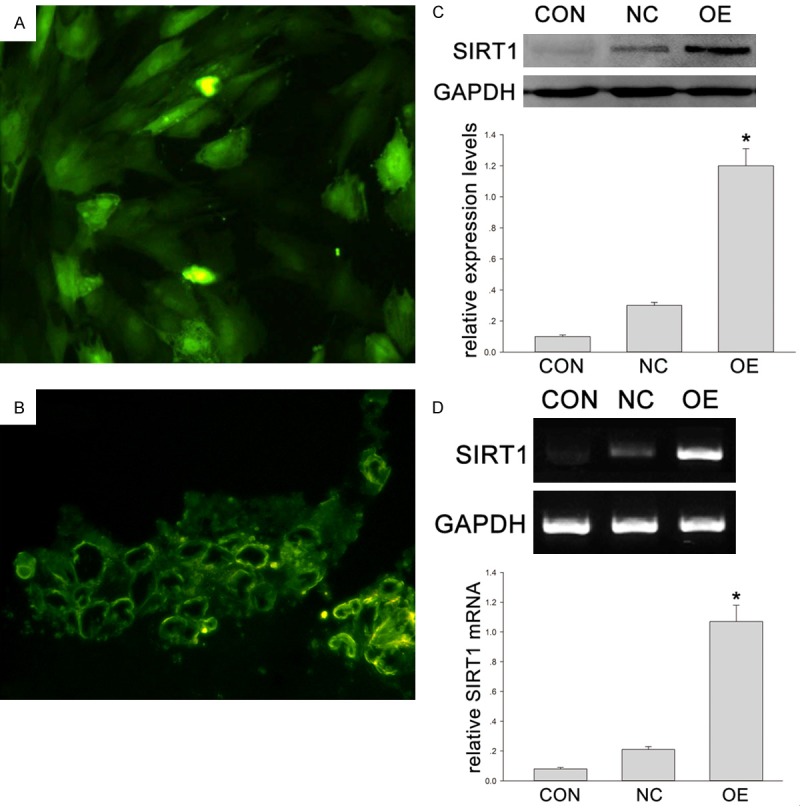
Figure 1.

A. The green fluorescence of DPSCs after 3-day transfection under a fluorescence microscope. B. A large amount of green fluorescence was observed under a microscope. C, D. Animals were divided into three groups: CON (control group or phosphate buffered saline group), NC (negative control or DPSCs transfected with Adv-GFP) and OE (overexpression group or DPSCs transfected with Adv-Runx2-GFP). C. The protein expression of SIRT1 in DPSCs transfected by adenovirus vector containing human SIRT1 gene (Western blotting). GAPDH served as a control. The optical density of SIRT1 was normalized to that of GAPDH at each time point. *P < 0.05. D. SIRT1 mRNA expression in DPSCs transfected by adenovirus vector containing human SIRT1 gene using (RT-PCR). GAPDH served as a control. Quantification of RT-PCR products. The quantity of amplified product was analyzed by an image analyzer. *P < 0.05.
