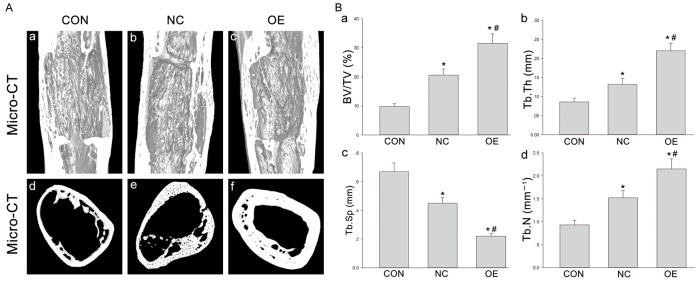
Figure 5.
A. The 3D micro-CT images of the distal femur distraction gap in Group CON (a, d), Group NC (b, e) and Group OE (c, f); longitudinal reconstruction (upper) and transversal section (lower) were shown. B. Parameters of the micro-structure of distraction gaps in all groups. *P < 0.05 vs Group CON; #P < 0.05 vs Group NC.

