
Figure 2.
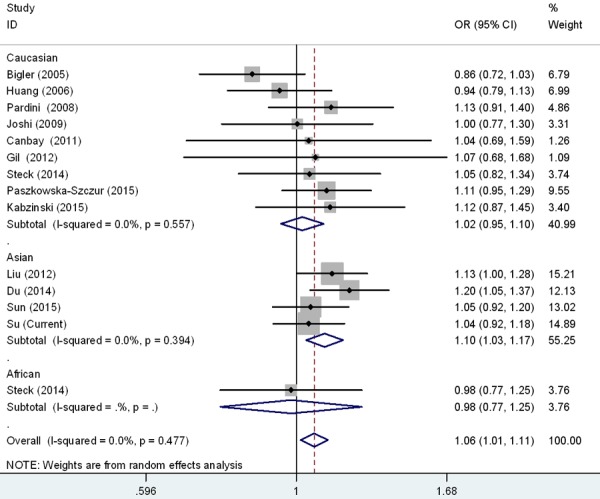
Forest plot for the CRC susceptibility associated with the rs17655 G > C polymorphism stratified by ethnicities under allele comparison model. The horizontal lines represent the study-specific ORs and 95% CIs, respectively. The diamond represents the pooled results of OR and 95% CI.