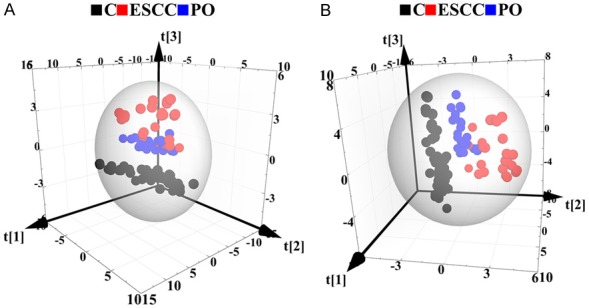
Figure 2.

A. 3D PCA score plots based on 1H CPMG NMR spectra of serum obtained from controls (C), ESCC, and PO groups. PCA score plots revealed separation trends and group clustering based on 1H-NMR spectra of the three groups (R2X = 69.0%, Q2 = 0.658). B. 3D PLS-DA score plots based on 1H CPMG NMR spectra of serum obtained from controls (C), ESCC, and PO groups (R2X = 68.6%, R2Y = 0.837, Q2 = 0.814).
