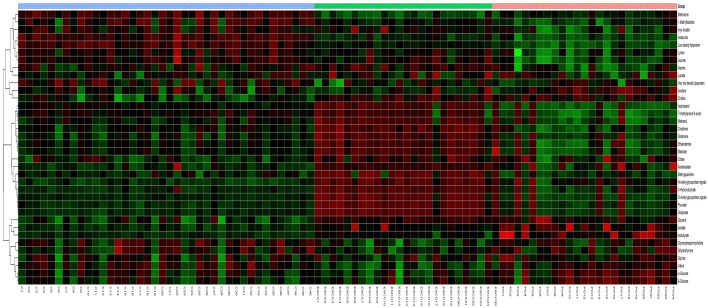
Figure 4.
Hierarchical cluster analysis of serum metabolic profile for distinguishing ESCC and PO from controls (C). Each column represents one serum sample, and each row represents a single metabolite. The expression values are represented by the color scale. The intensity increases from green (relatively down-regulated) to red (relatively up-regulated).

