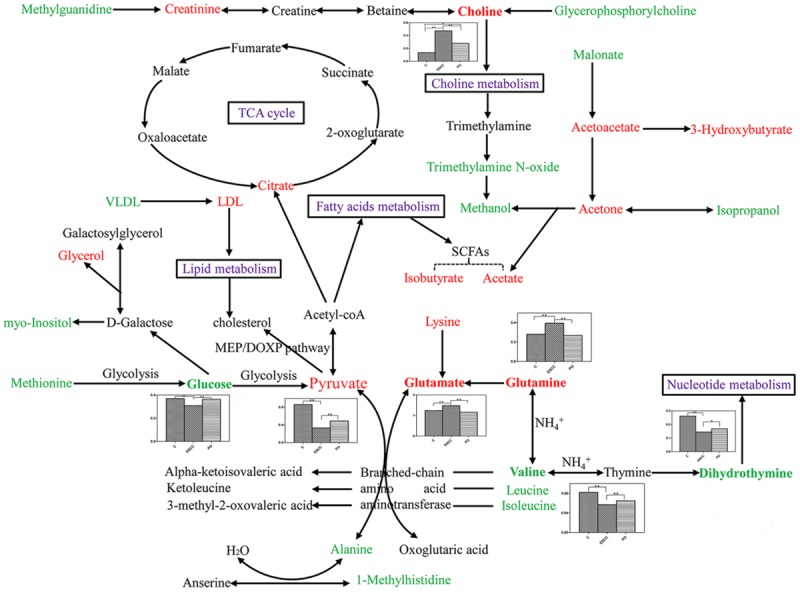
Figure 6.

Metabolic pathways of the altered metabolites that include controls, preoperative and postoperative early stage ESCC metabolite biomarkers identified in this study. The bold in metabolites with histograms represents potential biomarkers among three groups. Red texts mean up-regulated with respect to controls, and green texts mean down-regulated with respect to controsl. ‘▲▲’ means P < 0.01, ‘▲’ means P < 0.05.
