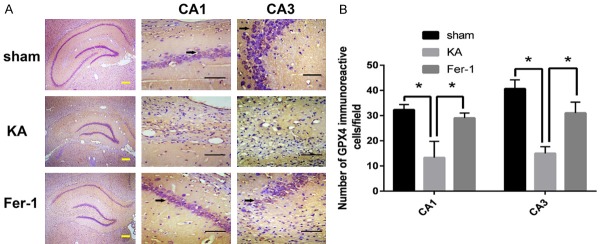
Figure 5.
Fer-1 restores GPX4 expression in the hippocampus of KA-treated rats. A. Representative photomicrographs of the iron positive area in CA1 and CA3 area of the hippocampus. Arrows show representative GPX4 immunoreactive cells. B. Quantitative analysis of the number of GPX4 immunoreactive cells. *P < 0.01 (vs KA) by one-way ANOVA (n = 3-5, each group). Scale bars: yellow bar = 200 μm, black bar = 50 μm.

