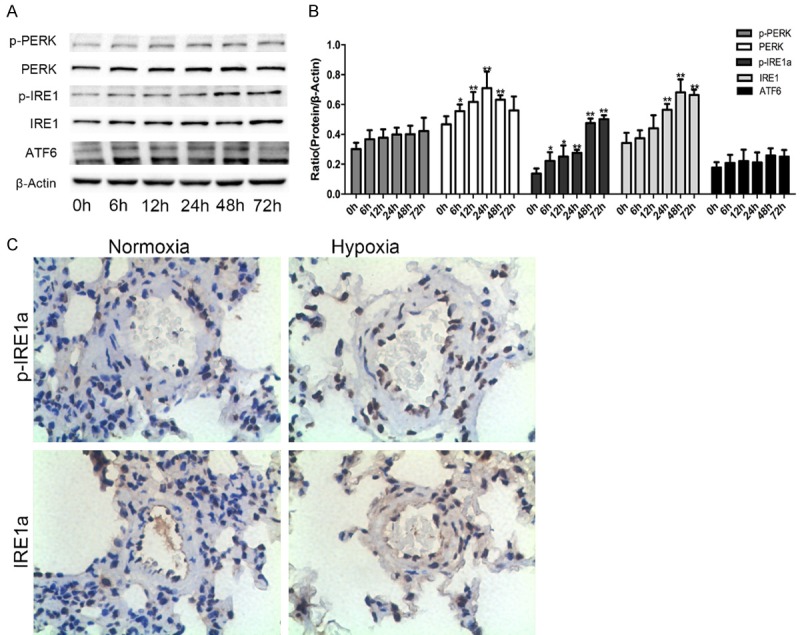
Figure 2.

Changes in the three UPR sensors in hypoxic rat PASMCs. A, B. Representative Western blots for three UPR sensors in PASMCs exposed to hypoxia for different times, and densitometry of bands was analyzed by using ImageJ software. C. Lung tissue sections from normal and hypoxia-induced pulmonary artery hypertension rats were stained immunohistochemically for the UPR sensors: IRE1α and p-IRE1α (magnification, × 400). Data are shown as the mean ± SEM; n = 4. *P < 0.05, **P < 0.01 compared with 0 h.
