
Figure 2.
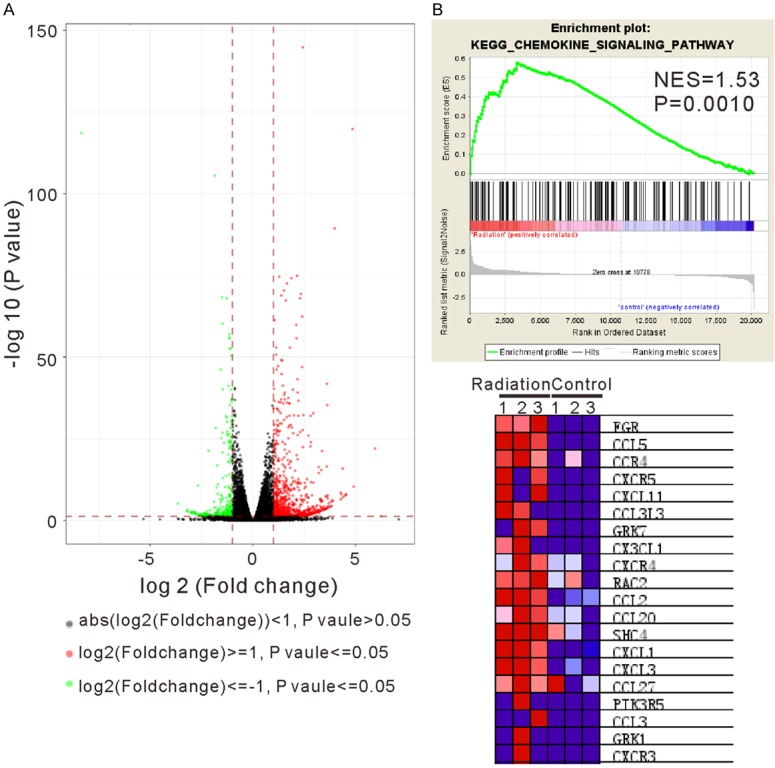
Analysis of significantly changed genes in response to radiation. A. Volcano analysis was performed with a minimum of a 2-fold change and P<0.05 between the Radiation group and the Control group. The log2 (fold change) is plotted on the x-axis and the negative log10 (P-value) is plotted on the y-axis. Red and green dots represented up-regulated and down-regulated genes, respectively. B. Gene set enrichment analysis (GSEA) showed that KEGG chemokine signaling pathway was correlated with radiation response. The enrichment plot (upper panel) and the top 20 enriched genes (bottom panel) are shown.