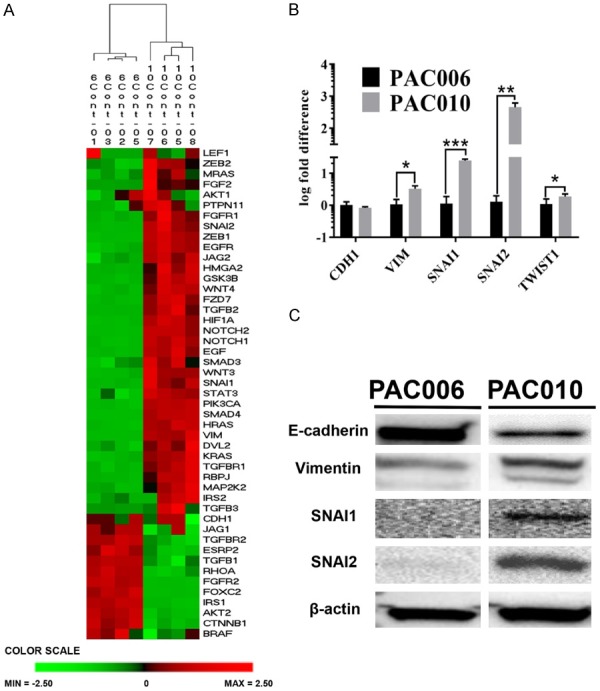
Figure 2.

Epithelial-to-Mesenchymal transition characteristics of the PDTX models. (A) The diagram presents the result of a two-way hierarchical clustering of a panel of EMT related genes (from IPA) in the untreated PAC006 and PAC010 models. The color scale at the bottom illustrates the relative level of EMT related gene expression in our models: red, above than the mean Z-score, green, below the mean. This analysis is validated by qRT-PCR (B) and Western blot (C) on selected representative EMT related genes. All experiments were performed at least in 3 biological repeats. qRT-PCR results are given as mean 2log fold difference ± SEM. Statistical significance was assessed using parametric (one-way ANOVA) (*: P<.05, **: P<.01, and ***: P<.001).
