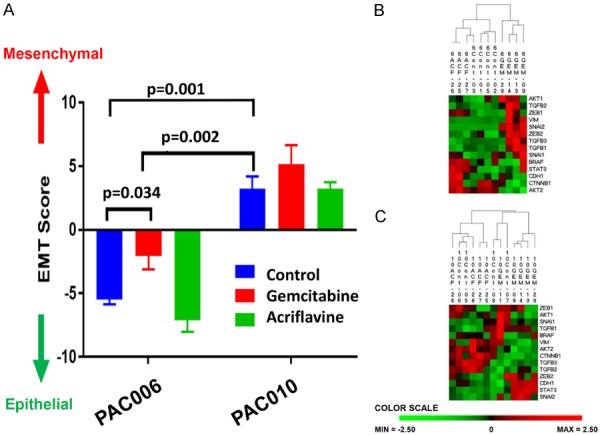
Figure 5.

Effect of treatment on EMT gene expression. Next Gen sequencing data were analyzed in detail. (A) To quantify Epithelial vs Mesenchymal phenotype of the tumors at the end of treatment we used a representative 8-gene relative EMT score (see materials and methods). Differences within a single model were statistically assayed with one-way ANOVA-test, between untreated PAC006 and PAC010 a t-test was used. (B) Heat map presentation of two-way hierarchical clustering analysis of prototype EMT genes for PAC006. The samples that had received gemcitabine clearly separated from the untreated control and ACF treated samples. (C) In PAC010, the animals that received GEM clustered together and the most of the ACF and control samples formed the second cluster. Most of the mesenchymal markers were up-regulated. The color scale illustrates the relative level of EMT related gene expression in our models: red, above than the mean Z-score; green, below the mean.
