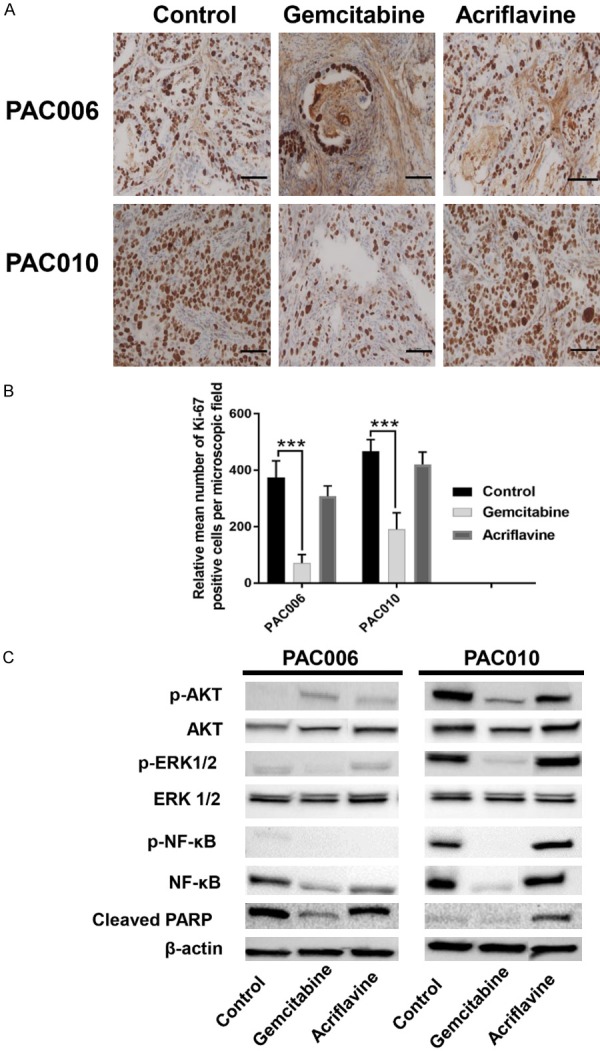
Figure 6.

Effect of drug treatment on cell proliferation and survival pathways. (A) Immunohistochemistry staining for Ki-67 shows nuclear positivity in representative sections of control and drug treated PDTX mice, bearing PAC006 or PAC010 models. Original magnification of images: × 20; scale bar 50 µm. (B) The quantification of nuclear Ki-67 immunostaining of tumor cells was done manually on sections of four different animals per condition. The number of Ki-67 stained cells is given as mean ± SEM (*: P<.05, **: P<.01, and ***: P<.001). Statistical significance was assessed using parametric (one-way ANOVA). (C) Representative Western blots of the two tumor models showing expression of phosphorylated and total Akt, phosphorylated and total ERK (42/44), phosphorylated and total NF-kB65 and cleaved PARP with β-actin as reference.
