
Figure 4.
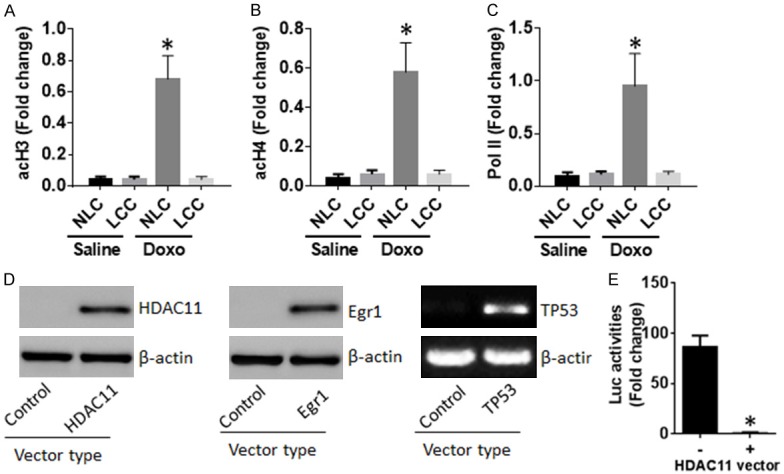
HDAC11 modulates TP53 promoter activities in NLC and LCC. (A-C) The preparation of NLC and LCC was the same as Figure 1. The nuclear extracts were analyzed by ChIP. The bars indicate the levels of acH3 (A), acH4 (B) and RNA polymerase II (Pol II; C) at the TP53 promoter locus of NLCs and LCCs. (D) HEK293 cells were transfected with plasmids of HDAC11, Egr1 and TP53, or control vectors. Two days later, the cells were analyzed by Western blotting and PCR respectively. The immune blots show the effects of the gene transfection. (E) The cells were analyzed by luciferase (Luc) activity assay. The bars indicate the luciferase activities in HEK293 cells. Doxo: Cells were exposed to doxorubicin (2 µM) in the culture. The data of bars are presented as mean ± SD. *P < 0.01, compared with the NLC (A-C) or cells without transfecting the HDAC11 vectors (E). The data represent 3 independent experiments.