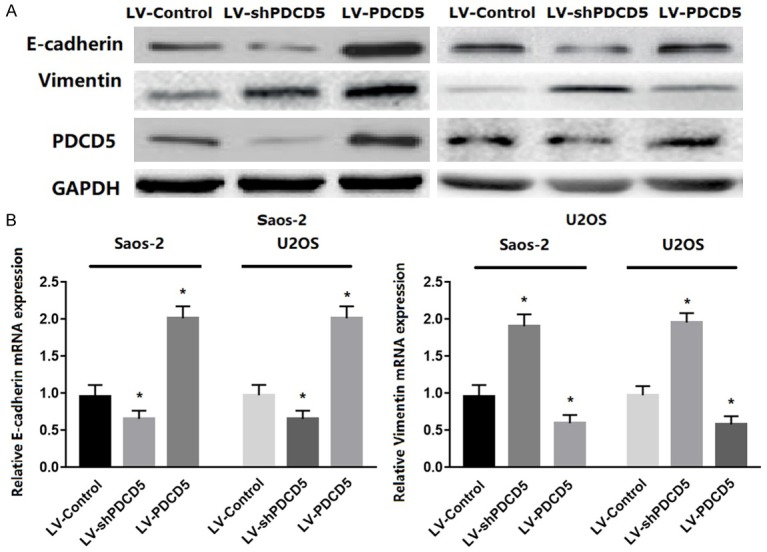
Figure 6.

PDCD5 regulated EMT in vitro. A. Western blot analysis of E-cadherin and vimentin proteins in PDCD5-overexpressing or PDCD5-silencing cells. B. Representative micrographs of E-cadherin and vimentin mRNA expressions in PDCD5-overexpressing or PDCD5-silencing cells as determined by real-time RT-PCR. Bars represent the mean ± SD of three independent experiments, *P<0.01.
