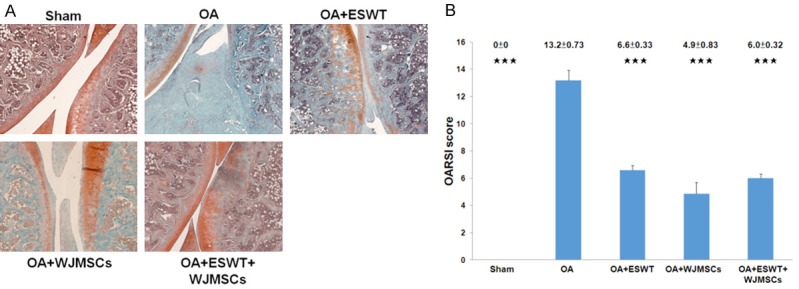
Figure 4.

The pathological changes of the rat knee after treatments. A. The microphotographs of the knee showed cartilage degradation in the different groups. The microphotographs of cartilage and subchondral bone were shown the changes of cartilage in OA group, OA+ESWT, OA+WJMSCs and OA+ESWT+WJMSCs groups (n = 6). The field of the view was 50 × magnification. B. The bar chart illustrated the results of OARSI score. ***P < 0.001 as compared with OA group.
