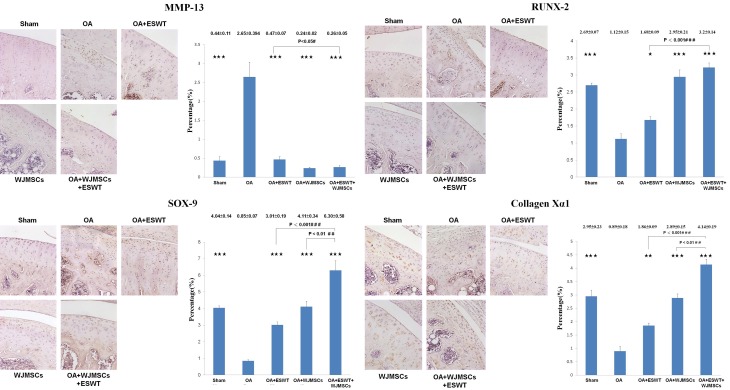
Figure 8.
The expression of the factors in the chondrogenesis after treatments on OA knee. The immunohistochemical stains (left) and quantification (right) showed the levels of the MMP-13, RUNX-2, SOX-9 and Collagen Xα1 after treatments on OA knee. The field of view was 100 × magnification. *P < 0.05, **P < 0.01, ***P < 0.001 comparing to OA group. The #P < 0.05, ##P < 0.01 and ###P < 0.001 comparing to OA+ESWT group. All rats were n = 6.

